Project Overview

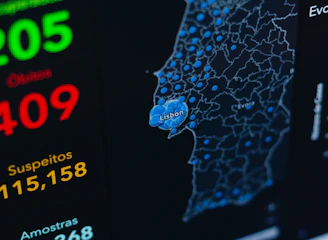
Visualize your data and insights for informed decision-making.

A smartphone displays analytics data with graphs showing views, downloads, and likes. It is resting vertically on a white dock next to a small potted succulent plant. In the background, a large computer monitor is partially visible, along with a closed laptop and a white wireless earbud case.
Market Trends

Analyze shifts in market dynamics and user behavior.

A digital dashboard displays metrics related to web performance. Graphs show detailed statistics such as total clicks, total impressions, average click-through rate (CTR), and average position over time. The chart utilizes various colors to distinguish different data sets, and the interface features tabs labeled 'QUERIES', 'PAGES', 'COUNTRIES', 'DEVICES', and 'SEARCH APPEARANCE'.
User Engagement

Track website interactions and optimize user experiences effectively.
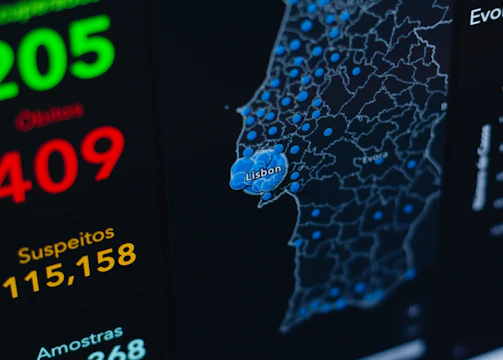
Detailed map displaying data visualization with blue circular markers representing specific data points across a geographical area labeled with city names such as Lisbon and Evora. Bold, brightly colored numerical statistics appear on the left side with the terms 'Suspeitos' and 'Amostras,' suggesting a context of data tracking or analysis.
A person is holding a smartphone displaying an analytics or insights screen with various metrics and numbers. The individual is wearing a casual white shirt and a watch with a black band. The surrounding environment includes an indoor plant.
Financial Insights

Monitor financial markets and make data-driven investment decisions.

Custom Dashboards

Create tailored dashboards for real-time data visualization.

Two laptops display dark-themed screens; one shows analytical graphs and statistics, including conversion rates, store sessions, and geographic distribution. The other screen displays a grid of web application icons. The scene is dimly lit, emphasizing the glow from the screens and the softly illuminated keyboards.

Gallery

Explore stunning visuals that bring your data to life.

A person with a striped shirt and a cap is standing in front of a computer screen displaying data and analytics. Another laptop is open on a desk below the monitor, and a large metallic tank with a pressure gauge is nearby.
A laptop displays a detailed financial chart with lines showing data trends. In the background, a person is partially visible, wearing a dark shirt with the words 'most valuable' and some logos printed on it. The setting appears to be a modern workspace.
A laptop displaying a financial dashboard with various stock market graphs and data. The screen shows different stock indices and their performance, including line charts and a bar chart for market overview. The laptop is placed on a light-colored table, and a gray sofa is visible in the background.
A laptop on a wooden desk displays a web application interface featuring graphs and statistics. Beside it, a large monitor shows a webpage promoting an all-in-one meeting app. A cup with a recognizable green and white logo sits on the desk.
A promotional banner with a bold red background features the text 'Data has a better idea' in large white letters. Above the text, the word 'HIVERY' is printed along with a stylized logo resembling a beehive. The background also includes a pattern of blue circles and dots, giving a digital or technological feel. In the surrounding area, there's a partial view of a desk and some office supplies.

Pulsechart Analytics transformed our data into actionable insights, enabling us to make informed decisions quickly. The real-time visuals are a game changer for our business.

John Doe

Lines of computer code are displayed on a dark background, featuring SQL and JavaScript syntax with colorful syntax highlighting. The code includes a SQL query and JavaScript function handling datasets.

★★★★★